Astrophysics
Spectroscopy: Reading Starlight
ConfirmedThe idea
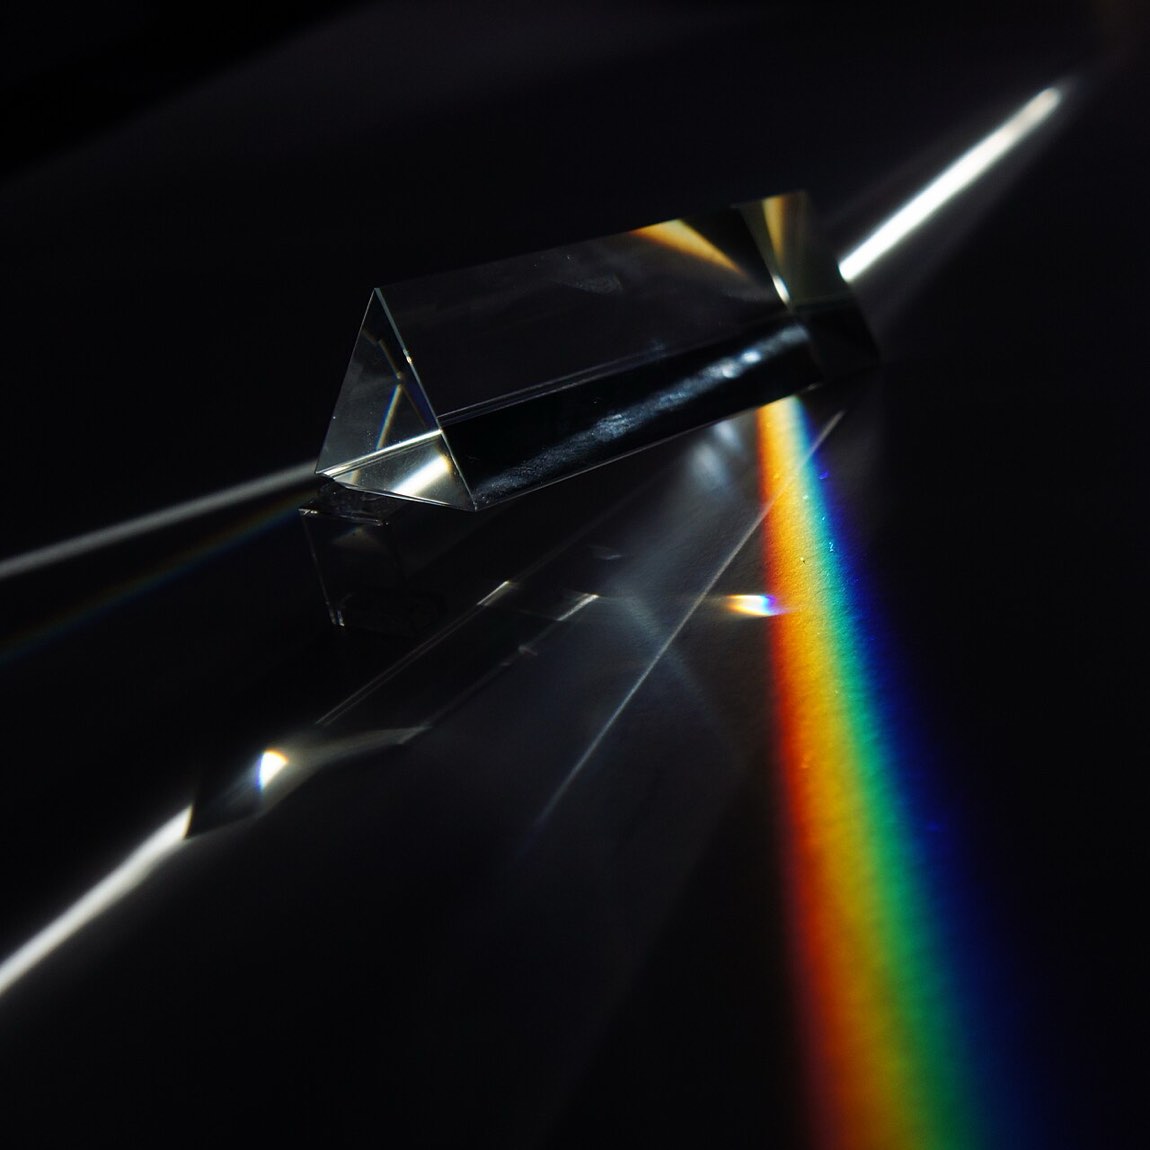
Pass starlight through a prism and a barcode of dark lines appears in the rainbow. Each chemical element absorbs light at its own signature wavelengths, so the barcode tells you exactly what a star is made of, from your chair, without visiting. This single trick turned astronomy from mapping lights into reading them.
Go deeper Advanced
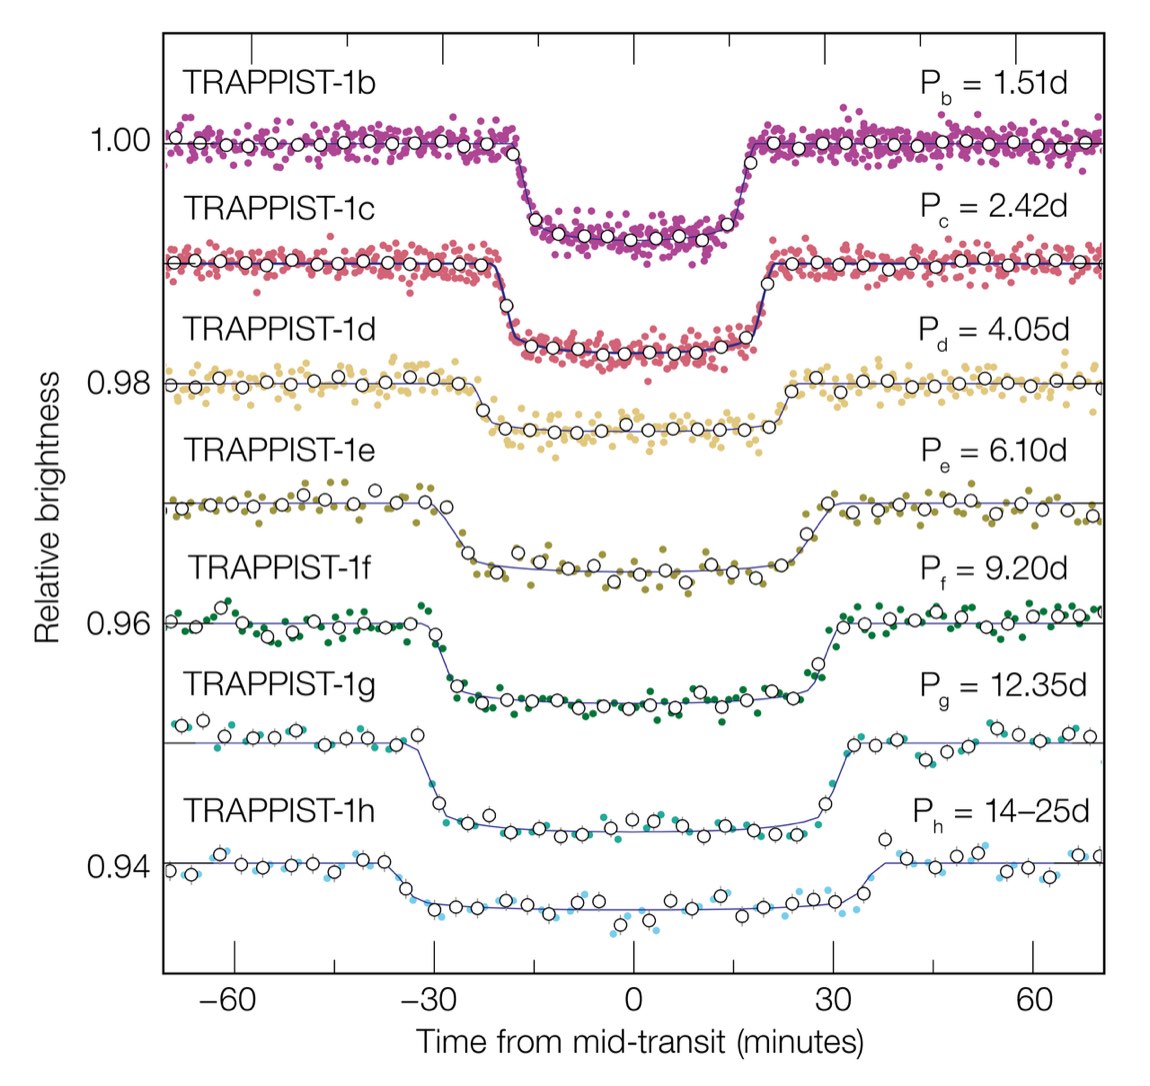
In 1835 the philosopher Comte declared stars' composition forever unknowable — spectroscopy shattered that within decades (and found helium on the Sun before it was found on Earth). Line shifts give velocity (Doppler), broadening gives pressure and rotation, splitting gives magnetic fields; molecular bands in transit light now reveal exoplanet atmospheres.
The deep dive
Researched for the Atlas from Wikipedia — Astronomical spectroscopy (23,900 characters read) · updated Sep 20, 2026
01 Fraunhofer's 574 dark lines
When Joseph von Fraunhofer turned his exceptional glassmaking skills toward optics in the early 1800s, he produced prisms pure enough to reveal something Newton's cruder instruments had missed: 574 distinct dark lines interrupting the Sun's otherwise continuous rainbow. Each line sat at a precise wavelength, reproducible night after night. Fraunhofer went further and combined his prism with a telescope, training it on Venus, the Moon, Mars, and stars including Betelgeuse — the first systematic stellar spectroscopy. His instruments were so well regarded that the company he founded kept manufacturing and selling high-quality refracting telescopes based on his original designs until it finally closed in 1884, more than half a century after his death. The lines he catalogued still carry his name, and the table of major Fraunhofer lines maps them to specific elements: the A and B bands to oxygen, the C line (Hα) to hydrogen, the D lines to sodium, and so on through the alphabet to the K line of ionised calcium. What he could not explain was why the lines were there at all — that answer waited another generation.
02 Kirchhoff and Bunsen decode the dark gaps
In the 1850s Gustav Kirchhoff and Robert Bunsen provided the physical explanation that Fraunhofer lacked. Their three rules, drawn from careful laboratory work, tied together three observations: a hot solid produces a continuous rainbow spectrum; a hot gas glows only at specific discrete wavelengths; and a hot solid viewed through a cooler gas shows that same continuous spectrum interrupted by dark gaps at exactly the wavelengths where the cool gas would otherwise emit. The Sun is a hot glowing body surrounded by a cooler gaseous atmosphere, so its spectrum is the third case — a near-continuous background crossed by absorption lines that fingerprint each element in its outer layers. By comparing those dark lines with the bright emission lines of gases burned in Bunsen's famous burner, chemists and astronomers could read the solar composition from Earth without ever leaving the ground. This was one of the most powerful unifications of laboratory physics and astronomy in the nineteenth century.
03 Helium found in the Sun before Earth
Not every line in the solar spectrum surrendered its identity quickly. During the solar eclipse of 1868, Norman Lockyer and Pierre Janssen independently noticed a spectral line sitting close to but distinct from the sodium doublet (the D1 and D2 lines). Lockyer concluded it belonged to an element not yet known on Earth and named it Helium, after Helios, the Greek Sun. The astronomical community was skeptical — claiming a new element from a single spectral line was bold. Skeptics were silenced in 1895, twenty-seven years later, when helium was finally isolated from a uranium mineral on Earth and its emission spectrum matched Lockyer's solar line exactly. The story is a vivid demonstration of spectroscopy's reach: astronomers identified a fundamental building block of the universe in a star 150 million kilometres away before chemists found it in a laboratory sample. Today helium is the second most abundant element in the universe, but its solar discovery came first.
04 Coronium, nebulium, and the forbidden Deeper
Two famous 'new elements' turned out to be familiar elements behaving in unfamiliar ways. In 1869 Charles Augustus Young and William Harkness independently spotted a bright green emission line in the Sun's corona during an eclipse; unable to match it to anything known, astronomers called the hypothetical element coronium. It remained unexplained for decades until Walter Grotrian and Bengt Edlén showed in the 1930s that the line at 530.3 nm comes from iron that has lost thirteen electrons — written Fe13+. The extreme temperature of the solar corona strips atoms to ionisation states never seen in a laboratory. Similarly, in 1864 William Huggins noticed that many nebulae showed pure emission lines, including two prominent ones at 495.9 nm and 500.7 nm that matched nothing terrestrial, prompting the invention of 'nebulium.' In 1927 Ira Bowen identified them as doubly ionised oxygen (O+2) emitting via forbidden line transitions — transitions that are so slow they almost never occur in a lab because the atom collides with a neighbour first. In a nebula, where density can be as low as one atom per cubic centimetre, atoms sit undisturbed long enough to make these otherwise invisible transitions.
05 Wien's law: temperature from color
Gustav Kirchhoff proposed the concept of a black body — a perfect radiator — in 1860, and by 1894 Wilhelm Wien had derived a precise mathematical relationship between a black body's temperature and the wavelength at which it emits most intensely. Wien's law states that the peak wavelength multiplied by the temperature equals a fixed constant b, equal to 2.897771955×10⁻³ m·K. The relationship is elegantly simple: hotter objects peak at shorter, bluer wavelengths; cooler objects peak at longer, redder ones. As a worked example the article gives: a star with a peak emission at 502 nm has a surface temperature of 5772 kelvins — which is the accepted surface temperature of the Sun. Once temperature is known, and once luminosity can be independently measured, the Stefan–Boltzmann relation L = 4πR²σT⁴ (where σ = 5.670374419×10⁻⁸ W·m⁻²·K⁻⁴) allows astronomers to solve for the star's radius R. In this way a single spectrum, analysed carefully, yields temperature, luminosity, and physical size without any spacecraft ever visiting the star.
06 How holographic gratings beat prisms Deeper
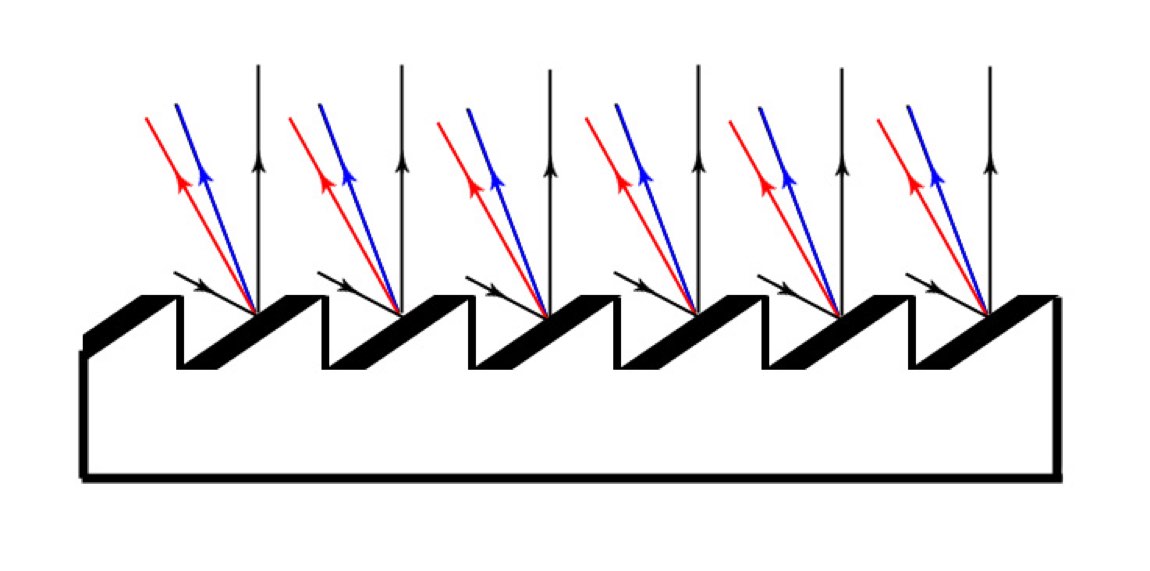
The evolution of the light-dispersing element at the heart of every spectrograph tracks the demand for finer and finer detail. Newton's simple glass prism gave way to Fraunhofer's superior hand-crafted versions, which in turn were surpassed by the reflection grating. In the early 1900s J.S. Plaskett at the Dominion Observatory in Ottawa developed high-quality blazed gratings — arrays of tiny parallel mirrors that exploit the small fraction of incident light refracted at a different angle to build up a focused, tunable spectrum. The catch is physical: mirrors can only be ground so fine, and the practical ceiling sits around 1000 lines per millimetre. Volume phase holographic gratings broke that barrier by replacing ruled mirrors with a thin film of dichromated gelatin on glass, exposed to an interference pattern from a laser interferometer. The resulting atomic-scale structure diffracts light via Bragg diffraction, reaching up to 6000 lines per millimetre and collecting up to twice as much light as a blazed grating of the same size. Sealed between two glass sheets, holographic gratings are robust enough to last decades. Modern optical spectrographs pair them with charge-coupled devices (CCDs) that replaced photographic plates, giving fully digital, calibrated spectra.
 ⤢
⤢
07 The 21 cm line maps the Milky Way
Neutral hydrogen in its ground state can exist in two slightly different configurations depending on whether the electron's spin is aligned with or opposed to the proton's spin. When hydrogen flips between these states it emits or absorbs a photon at exactly 21 centimetres wavelength — a radio wave that sails straight through dust clouds that block visible light entirely. Radio spectroscopy began with Karl Jansky's accidental detection of radio emission from the centre of the Milky Way in the early 1930s while he was working for Bell Labs investigating interference on transatlantic transmissions. The 21 cm hydrogen line itself was discovered in 1951, and it immediately became an indispensable tool: its Doppler shift reveals the velocity of each hydrogen cloud; its intensity gives the density and number of atoms in the cloud; and its temperature can be derived from the line profile. By mapping 21 cm emission across the sky, astronomers determined that the Milky Way is a spiral galaxy — something impossible to see optically from inside the disc. The exact number and positions of the spiral arms, however, remain a subject of ongoing research.
08 Fritz Zwicky and the missing mass
In 1937 Fritz Zwicky applied Doppler shift measurements to galaxies within clusters and found a serious inconsistency. Individual galaxies were moving far faster than the visible mass of the cluster could gravitationally explain — if only the luminous stars and gas were holding things together, the clusters should have flown apart long ago. Zwicky proposed that enormous quantities of invisible, non-luminous matter must be present, which he called dark matter. Subsequent generations of astronomers confirmed that a large portion of individual galaxies, and most of the universe's total mass, appears to be dark matter. The situation became more complicated in 2003 when four specific galaxies — NGC 821, NGC 3379, NGC 4494, and NGC 4697 — were found to have little to no dark matter influencing the motion of their stars. Why these particular galaxies apparently lack dark matter while their neighbours have it in abundance remains unexplained, making them important test cases for competing theories of gravity and galaxy formation.
09 Quasars: galaxies hiding in plain sight
In the 1950s radio astronomers kept finding powerful radio sources associated with objects that looked, in visible light, like faint reddish smudges — nothing dramatic. When spectroscopists finally captured a spectrum of one of these objects, they found absorption lines at wavelengths where no lines were expected. The puzzle dissolved once someone recognised the pattern: these were ordinary galactic spectral lines, but shifted so far toward the red end of the spectrum that they appeared at completely unfamiliar positions. The objects were moving away from us at tremendous speed, meaning they were enormously distant. Hong-Yee Chiu coined the term quasi-stellar radio sources — quasars — in 1964. The enormous energy output required to be visible across such distances is now attributed to supermassive black holes consuming material at the centres of young galaxies formed in the early universe. Quasars are therefore not a bizarre separate class of object but a stage in galactic evolution, revealed only through spectroscopy's ability to measure both composition and velocity simultaneously.
10 Slipher, Hubble, and the expanding sky
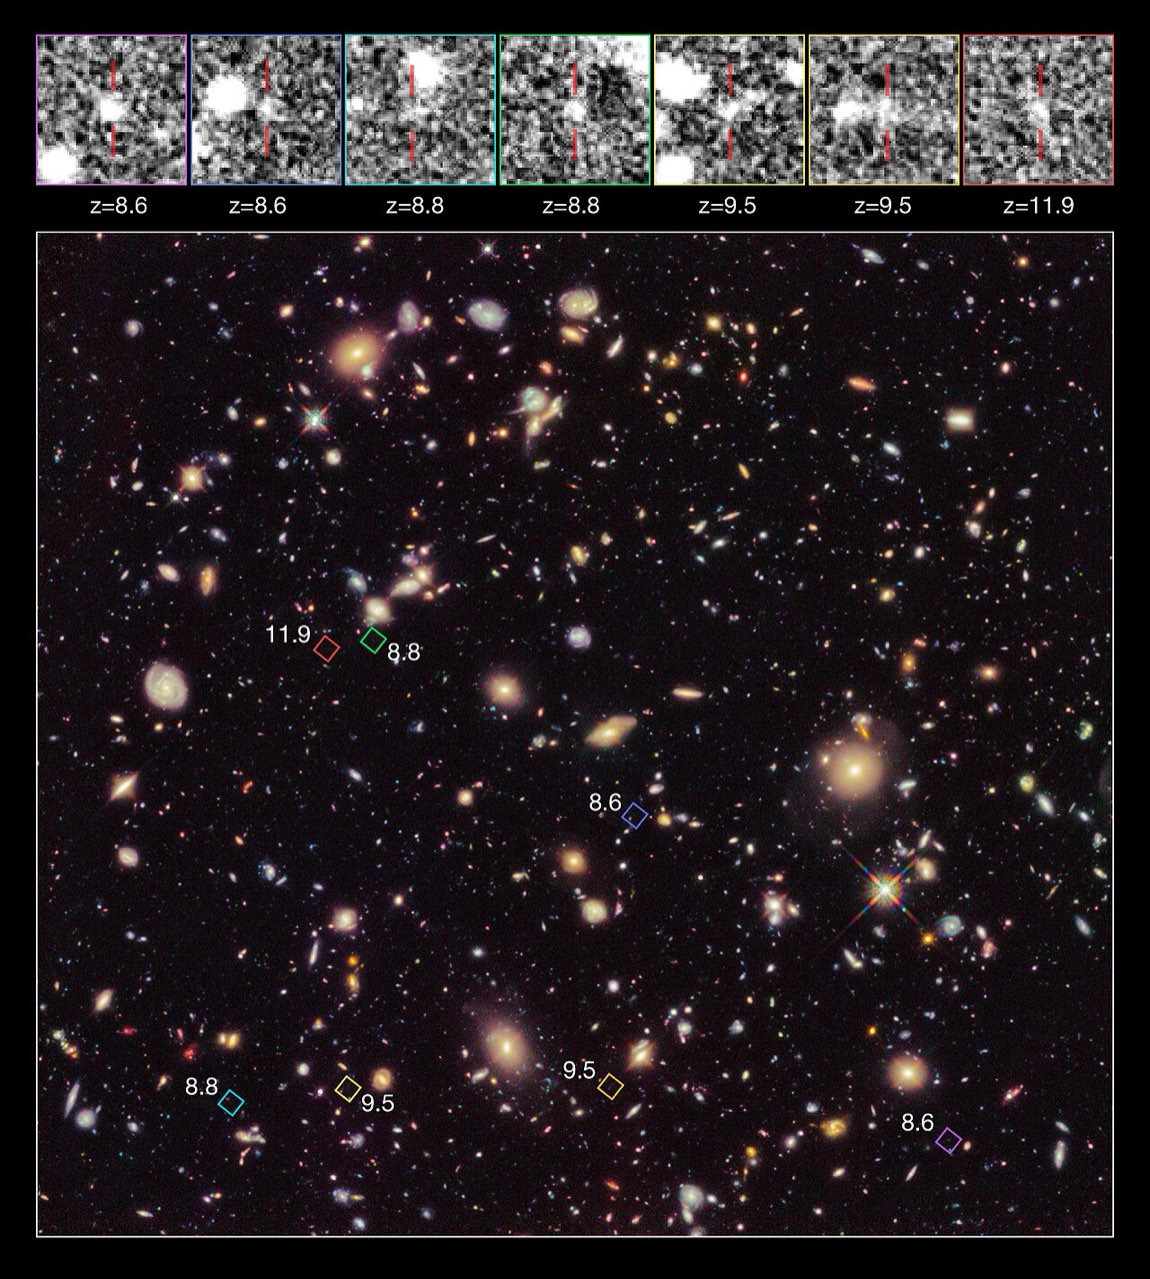
In 1913 Vesto Slipher measured the spectrum of the Andromeda Galaxy and found it blueshifted — moving toward the Milky Way. He then recorded the spectra of 20 other galaxies and found all but four were redshifted, meaning they were receding, and calculated their velocities relative to Earth. Edwin Hubble later combined Slipher's velocity data with his own distance measurements to formulate Hubble's law: the further a galaxy, the faster it recedes, expressed as v = H₀d where H₀ is the Hubble Constant. Redshift z encodes how much the wavelength has stretched during the light's journey; as of January 2013 the largest galaxy redshift found using the Hubble Ultra-Deep Field was approximately z~12, corresponding to light from an object more than 13 billion years old in a universe approximately 13.82 billion years old. Peculiar velocities — the gravitationally driven motions of galaxies within clusters superimposed on the overall expansion — complicate the picture. The Virgo Cluster, for instance, has been the subject of intense scrutiny because its member galaxies show unusually large peculiar velocities that distort simple redshift-based distance estimates.
11 Asteroids classified by reflected light
Rocky bodies too small to shine by fusion still carry spectral fingerprints in the sunlight they reflect, and astronomers have built entire classification schemes from those signatures. The original three-category system for asteroids was created by Clark R. Chapman, David Morrison, and Ben Zellner in 1975: C-types rich in carbonaceous material, S-types dominated by silicates, and X-types described as metallic. David J. Tholen expanded this framework in 1984 into what is now called the Tholen classification, which remains a standard reference. By 2002 more detailed spectroscopic surveys prompted a further revision into the SMASS classification, which expanded the number of distinct categories from 14 to 26 to capture finer compositional differences. C-type and S-type asteroids are the most common. The spectral approach to asteroid taxonomy is essentially the same logic applied to stars — match the reflected or emitted light pattern to known mineral or elemental spectra — but scaled down to objects that produce no light of their own.
12 Interstellar chemistry: organic molecules in space Deeper
The space between stars is far from empty or chemically simple. The interstellar medium is 99% gas — primarily hydrogen and helium with traces of ionised oxygen and other elements — and 1% dust thought to consist mainly of graphite, silicates, and ices. Within this medium, spectroscopists have detected a remarkable zoo of molecules, their signatures appearing in radio, microwave, and infrared bands through rotational and vibrational transitions of their chemical bonds. Most known interstellar compounds are organic. They range from small molecules such as acetylene (C₂H₂) and acetone ((CH₃)₂CO) to entire families of large structures: fullerenes, polycyclic aromatic hydrocarbons, and solid sooty carbonaceous grains. These molecules form through chemical reactions in cold diffuse clouds or in dense regions bathed by ultraviolet light. Their existence challenges the historical assumption that complex chemistry requires warm, planet-bound conditions. Meanwhile, cometary spectra add another layer: Comet ISON's composition was read from prominent emission lines of cyanogen (CN) and two- and three-carbon clusters (C₂ and C₃), and nearby comets even emit X-rays when solar wind ions are neutralised in the coma — meaning cometary X-ray spectra actually reveal the state of the solar wind, not the comet itself.